
The weekly note
This Week’s Developments in the US Economy
Housing Affordability Is Worsening
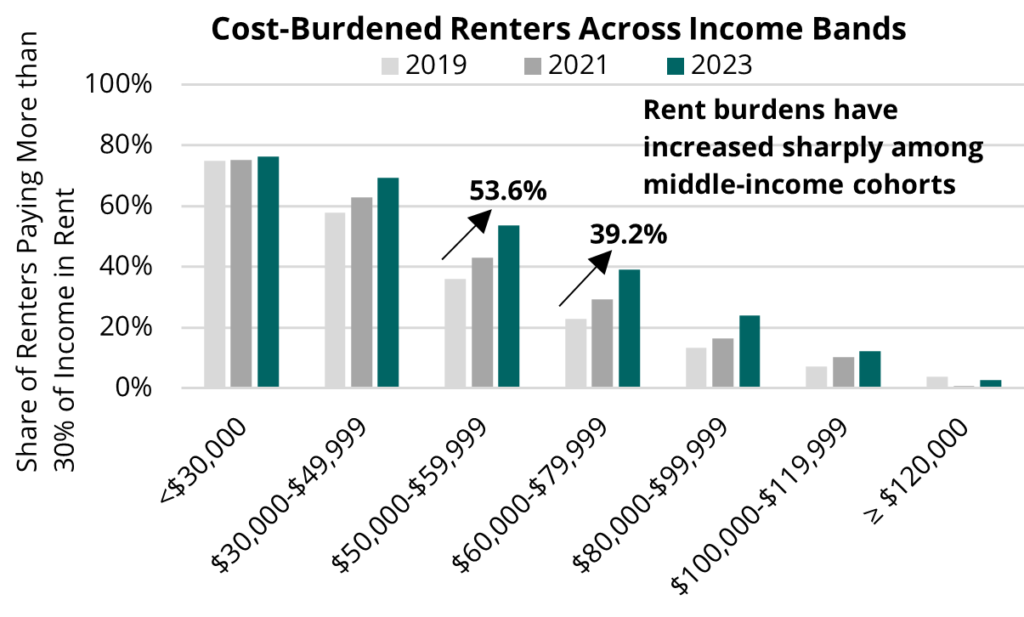
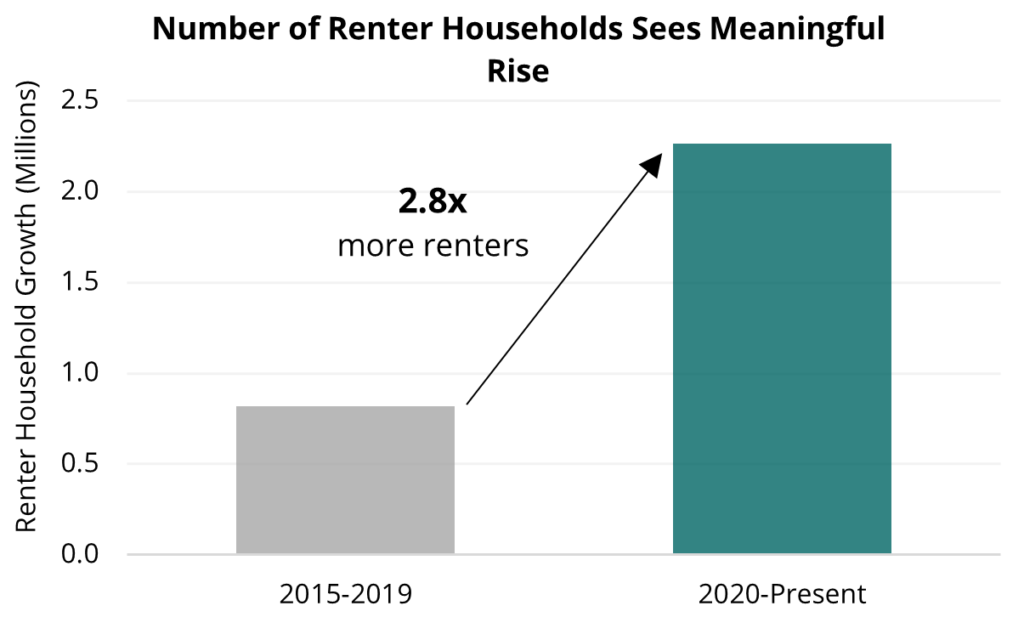
The sense that housing affordability has worsened for US renters is not inaccurate—in fact, it appears that the housing system has lost ground gained in the previous business cycle. To some extent, we can see the implications of a market that continues to fall short in delivering sufficient new workforce housing or preserving existing affordable stock. While the share of cost-burdened renters declined from 2010 to 2019, it has steadily risen since then as cost burdens have increased across nearly all income levels, increasing by over two million renter households overall (see accompanying visual). Currently, nearly half of U.S. renters are cost-burdened, spending more than 30% of their income on housing, with 53% of newly formed renter households in 2023 also falling into this category.
It seems, in our view, that worsening affordability conditions is more complex than just a supply issue. We believe that three main factors are paramount: growing demand overall for rental housing; lack of appropriately priced supply forcing moderate-income households to become market price takers; and years of structural supply deficits. Together, these factors have exacerbated affordability challenges, making it increasingly difficult for many renters to find housing that aligns with their financial capabilities.
Rising Demand for Rental Housing and Shifting Renter Demographics
Demand for multifamily housing remains robust. Since 2020, net renter household formation has totaled 2.3 million–nearly three times the pace of the previous five-year period. Furthermore, in 2024, net absorption of multifamily units reached nearly 670,000—the second-highest level in two decades, trailing only peaks seen at the end of 2021 and beginning of 2022. This figure is nearly double the typical annual absorption of 250,000 to 350,000 units.
This demand is partly driven by rising barriers to homeownership, as higher mortgage rates and elevated homeownership costs have extended rental tenures. Additionally, shifting preferences and economic constraints have expanded the renter base across a wider range of income levels and age demographics, reinforcing long-term demand growth. We anticipate that this trend will persist, contributing to sustained demand through 2025 and beyond.
Growing Demand for Workforce and Affordable Housing Among Moderate Income Households
Rising rent burdens and the lack of affordable housing options have placed significant financial strain on millions of households across the US. Moderate-income households earning between 51% and 80% of area median income (“AMI”)—an estimated 9.5 million renter households—often face a dual challenge: they neither qualify for government-subsidized housing nor can they afford newly developed units, which are priced significantly higher. As a result, these households contribute to heightened demand for affordable housing options, further straining an already limited supply.
Supply Shortages and Market Imbalances
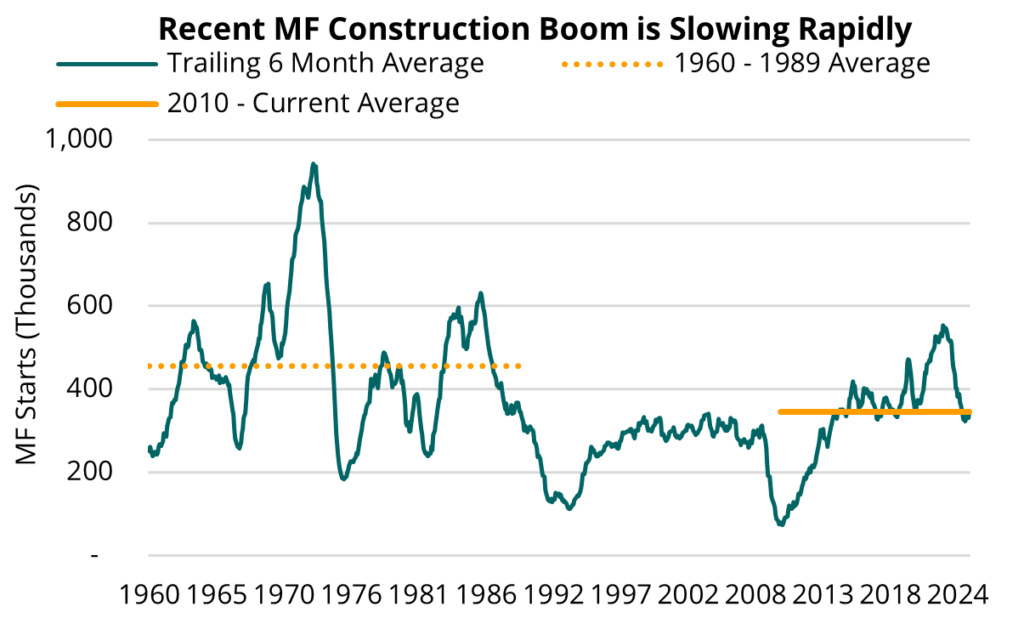
The US housing market continues to experience a significant supply deficit, exacerbating affordability pressures. Current vacancy levels remain below long-term historical averages, and our internal analyses suggests that at least 2.6 million additional units are needed to restore market equilibrium. Although some markets have seen an uptick in supply, this follows a prolonged period of historically low development. From 2010 to 2024, the average pace of multifamily starts was close to 25% below the historical average from the 1960s through the 1980s, failing to keep up with rapid household formation, particularly among Millennials.
Although multifamily starts peaked in 2022, development activity has since declined sharply due to rising construction costs and high interest rates. In 2024, about 420,000 multifamily units were started, more than 30% below the peak in 2022. With new development slowing, we anticipate that robust demand will absorb new supply and push the market back into supply constraints. A resurgence in multifamily construction appears unlikely without significant reductions in construction costs, which may drive rent growth, further straining moderate-income renter households.
Addressing the Affordability Crisis in the US Rental MarketThe US rental housing market is likely to face an ongoing affordability crisis driven by the increasing demand for rental housing, the rent-burden on moderate income households, and supply shortages. Although there has been a recent increase in new supply, affordability challenges remain, as many newly developed units are Class A properties. While long-term market dynamics suggest that newly built Class A housing will eventually filter down to become more affordable, this process takes time and offers no immediate relief to the two-plus million additional renter households that have become cost burdened since 2019 (see accompanying visual).
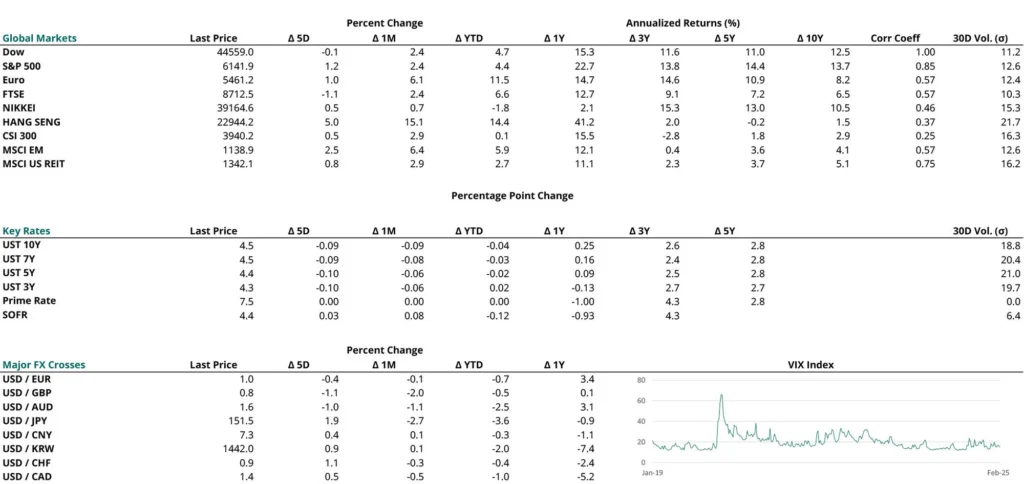
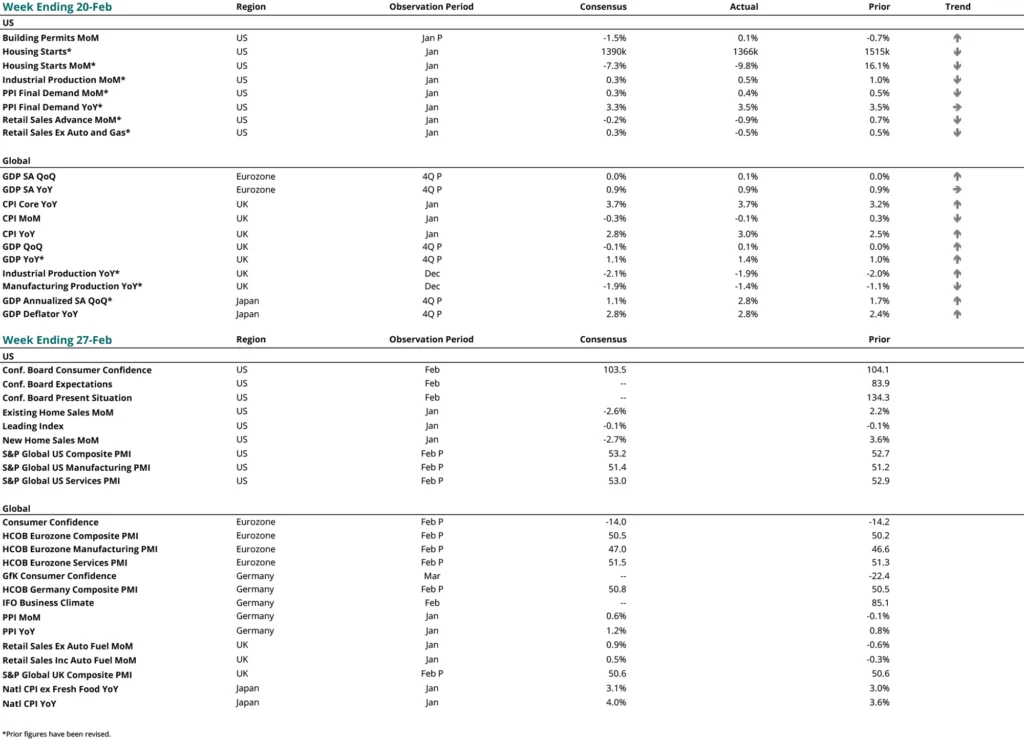
Market Rates, Catalytic Indicators, and the Week Ahead
subscribe to our market outlooks and sector insights
Disclosures
© 2025 Bridge Investment Group Holdings LLC. “Bridge Investment Group” and certain logos contained herein are trademarks
owned by Bridge.
The information contained herein is for informational purposes only and is not intended to be relied upon as a forecast, research, investment advice or an investment recommendation. Reliance upon the information in this material is at the sole discretion of the reader. Past performance is not necessarily indicative of future performance or results.The information contained herein is for informational purposes only and is not intended to be relied upon as a forecast, research, investment advice or an investment recommendation. Reliance upon the information in this material is at the sole discretion of the reader. Past performance is not necessarily indicative of future performance or results.
This material has been prepared by the Research Department at Bridge Investment Group Holdings LLC (together with its affiliates, “Bridge”), which is responsible for providing market research and analytics internally to Bridge’s strategies. The Research Department does not issue any independent research, investment advice or investment recommendations to the general public. This material may have been discussed with or reviewed by persons outside of the Research Department.
This material does not constitute an offer to sell any securities or the solicitation of an offer to purchase any securities. This material discusses broad market, industry, or sector trends, or other general economic, market, social, legislative, or political conditions and has not been provided in a fiduciary capacity under ERISA.
Economic and market forecasts or estimated returns presented in this material reflect the Research Department’s judgement as of the date of this material and are subject to change without notice. Although certain information has been obtained from third-party sources and is believed to be reliable, Bridge does not guarantee its accuracy, completeness, or fairness. Bridge has relied upon and assumed without independent verification, the accuracy and completeness of all information available from third-party sources. Some of this information may not be freely available and may require a subscription or a payment. Any forecasts or return expectations are as of the date of material and are estimated and are based on market assumptions. These assumptions are subject to significant revision and may change materially as economic and market conditions change. Bridge has no obligation to provide updates or changes to these forecasts.
This material includes forward-looking statements that involve risk and uncertainty. Readers are cautioned not to place undue reliance on such forward-looking statements. Any reference to indices, benchmarks, or other measure of relative market performance over a specified period of time are provided for context and for your information only.